
SMARTER AND GREENER
SATAVIA’s atmospheric digital twin: hyper-scale at hyper-speed
– Daniel Bannister (Chief Scientific Officer) and Dan Baker (Chief Technology Officer)
A quick search on the web shows that nobody’s really developed a precise definition of ‘hyper-scale.’ But that’s about to change.
At SATAVIA we define hyper-scale (or hyperscale if you’re in a hurry) in simple terms:
HYPER-SCALE MEANS ONE QUADRILLION COMPUTATIONS PER SIMULATION DAY
(1 quadrillion = 1,000 trillion = 100,000 times as many stars as there are in the Milky Way. So, quite a lot.)

That level of computation lets you do lots of cool stuff, like generating a ‘digital twin’ of the entire Earth’s atmosphere from ground-level to space.
And that’s precisely what SATAVIA did last December at a high-profile WIRED event, working together with Microsoft UK and making unprecedented use of their incredible Azure cloud-compute platform.
First, we diced the sky up into 4 billion 3-D cells, and then scaled our numerical weather prediction model to run on each and every one of them. In simple terms, we hoover up all the atmospheric data we can get our hands on, and then run it through our numerical weather prediction model, using supercomputing power in the cloud. And if you run 100 algorithmic computations for 26 meteorological parameters across 4 billion model cells every 30 seconds, you get 1 quadrillion computations per simulation day. You get hyper-scale.
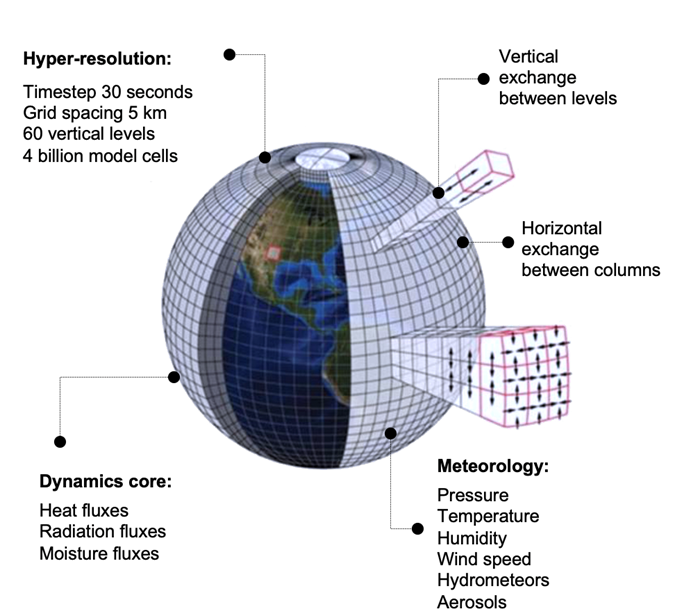
Our digital twin of the atmosphere is time-fluid, meaning that we can model historical data as well as making super-accurate forecasts for the next twenty-four hours. Since we run our digital twin on our proprietary DECISIONX platform, we often refer to it as 4-Dx: DECISIONX in four dimensions, 3-D plus time.
Once you’ve got your 4-Dx digital twin set up, you can run all kinds of amazing applications. To name just one, you can trace moving objects through the atmosphere and perform super-complex, on-the-fly calculations about the conditions they’ll encounter en route and in specific locations. The sky’s literally the limit!
With a four dimensional database of global atmospheric contaminant data, we can work out useful things like corrosion risks for aircraft, airports, ships, or any other vehicles transiting through specific routes, as well as static assets – that’s SATAVIA’s DECISIONX:FLEET use case.
By understanding atmospheric conditions at incredibly high resolution, we can also forecast condensation trail (contrail) formation by aircraft at cruise altitudes. Contrails are responsible for ~60% of aviation’s climate impact, or 2% of all human climate impact. By helping aircraft operators to prevent contrails through smarter flight planning, we can make big reductions in surface warming, at scale, planet-wide, and literally overnight – that’s our DECISIONX:NETZERO offering.
There’s all sorts of other cool stuff we’re looking at too, like validating the accuracy of satellite sensors. So maybe the sky isn’t the limit after all!
Hyper-scale at hyper-speed
OK, so we achieved hyper-scale – 1 quadrillion computations per simulation day. But that’s not all we did. We achieved it at hyper-speed, too, spooling up from a kick-off meeting on 1st December to a successful test at hyper-scale on 10th December. At SATAVIA we put a high premium on retaining our agile start-up mentality, but this was our biggest challenge yet. It was hyper-scale at hyper-speed, spinning more plates and extinguishing more fires than we’d ever attempted simultaneously. It was ten days of moving fast and making things, working closely with Microsoft Azure engineers to deliver a fantastic WIRED presentation on schedule. Here’s a summary of what we did, when, and how, with lots of juicy details for techies; the only thing missing is how much coffee we needed on each day. (Hint: by Day 5 a quadruple espresso wouldn’t cut it.)
The ten days before Christmas
Day 1
Kick-off meeting on hyper-scale test, on what seemed like a regular Tuesday in December. Little did we know what awaited us down the line!
Day 2
We increase quota to ~3000 vCPUs, initiating scale testing while waiting for quota upgrade to come online.
Day 3
First up-scaled successful test run, implementing a Europe-sized domain (~15% of the Earth) with 10 nodes (83% faster than our usual). The coffee orders start to ramp up.
Day 4
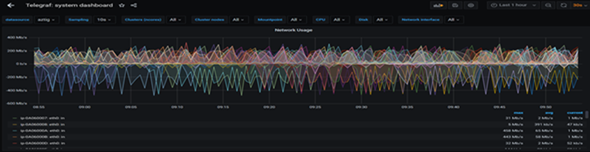
We add monitoring, merging Aztig (Telegraph, InfluxDB and Grafana) into our cluster-init. We run a second successful test on a Europe-sized domain with 15 nodes, and increase our quota to 36,000 cores. The quality of foodstuffs consumed begins to decline, and bags of Haribo were now on order.
Day 5
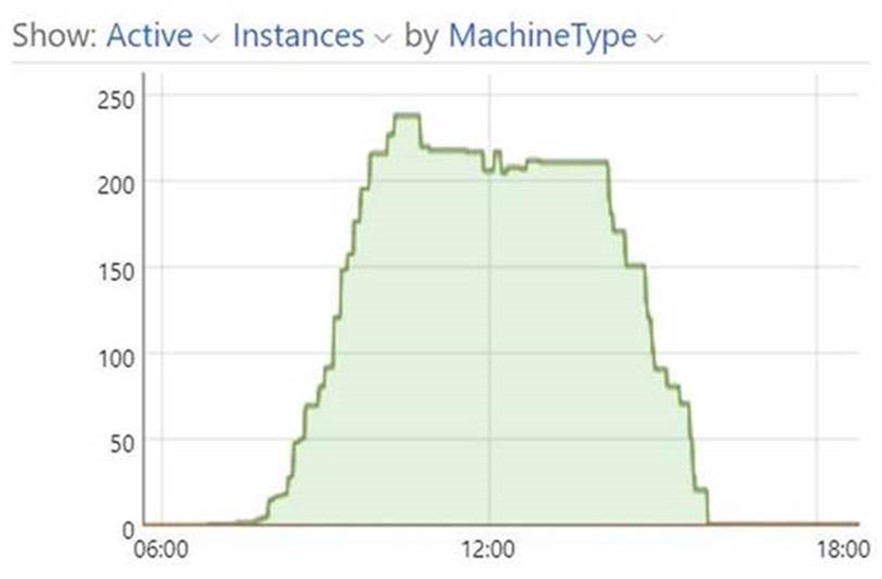
We kick off a sleepless working weekend by deploying a larger cluster of 300 nodes with Grafana, experiencing ~80% success implementing 10 Europe-sized domains in parallel with 10 nodes each (=12,000 cores).
Day 6
Things don’t go quite so well with a Hemispheric (50% of Earth’s surface) domain running on 50 nodes. Coffee orders redouble.
Day 7
The working week begins – core team don’t notice the difference. Regroup following Sunday’s challenges and request increase from 100 node limit in VMSS, while also scaling master node to D8 to cope with loading from NFS, InfluxDB, and Grafana.
Day 8
Following some storage upgrades, we run another large-scale test with near-total success, implementing 17 Europe domains on 170 nodes (20,400 cores). By now, SATAVIA’s Chief Scientific Officer and Chief Technology Officer are largely adrenaline- and caffeine-based organisms.
Day 9
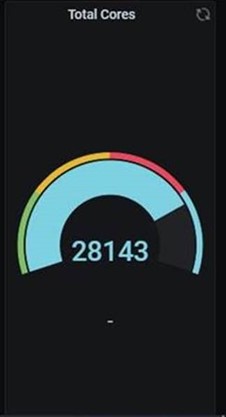
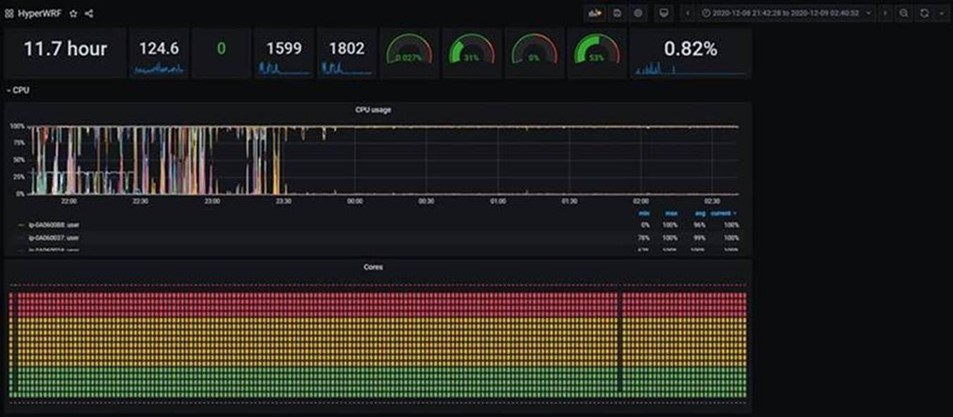
Hyper-scale success! We drew on 237 nodes (28,143 CPU cores) to simulate 54 days in less than 12 wall clock hours, the equivalent of running a 30-hour forecast for 296% of the Earth’s surface.
A few more techie details for the curious:
- Between 0716 – 1133 UTC on 10th December 2020, 54 separate (30 hour) forecasts were submitted to the Microsoft Azure Cyclecloud cluster. The forecasted dates spanned 26th June – 18thAugust 2020
- Each forecast was run on 10 x HB120s, and (on average) took just under 2 hours to complete
- Each simulation produced 104 GB of data, totaling 5.6 TB for all 54 simulations
- At any one time, 21 days were running concurrently. This is equivalent to simulating 115% of the Earth’s surface area at any one time
- The peak number of nodes at any one time was 237 (equaling ~28,440 cores).
- This plateaued at 217 nodes for a significant amount of time, indicating that this was the absolute limit of available resources for the day
The take-home message for the team? Anything’s possible with enough compute, enough commitment – and enough coffee!